Statistics Worksheets

Practice and master statistics and data concepts with our helpful walkthroughs and downloadable practice worksheets from our team of elite math educators.

Normal Distribution

By Puja Varude

The normal distribution, also known as the Gaussian distribution, is a symmetric probability distribution centered on the mean, indicating that data around the mean occur more frequently than data far from it. The normal distribution will show as a bell curve on a graph.

Why is this concept useful?

As it fits many natural occurrences, the normal distribution is the most important probability distribution in statistics. Height, blood pressure, measurement error, and IQ scores,Salary. All follow the normal distribution. It's also known as the bell curve or the Gaussian distribution.

Where does this concept fit into the curriculum?

High school

How to Use Normal Distribution:

  • The normal distribution is a unimodal( Bell shaped)
  • The normal distribution is symmetric about its mean.
  • The mean characterizes the position of the normal distribution.
  • The standard deviation characterizes the spread of the normal distribution.
  • X ~ N(μ, σ): The variable, X, follows the normal distribution, N, has the mean, μ, with a center deviation, σ.
  • z-score = no. of σ-units above (positive z) or below (negative z) distribution mean μ
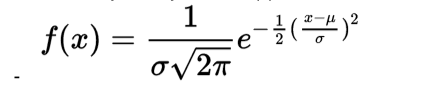
  • Probability density function f(x)

Sample Math Problems

Question

The set numbers are  normally distributed with μ = 100 and σ = 15; X ~ N(100, 10)

Solution

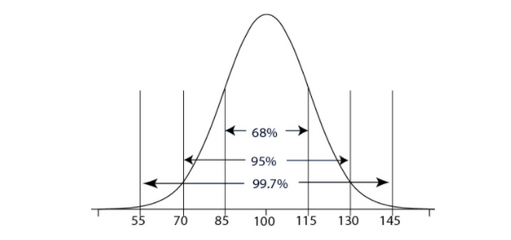
68% of scores within μ ± σ

= 100 ± 15

= 85 to 115

95% of scores within μ ± 2σ

= 100 ± (2)(15)

= 70 to 130

99.7% of scores in μ ± 3σ =

100 ± (3)(15)

= 55 to 145

Question

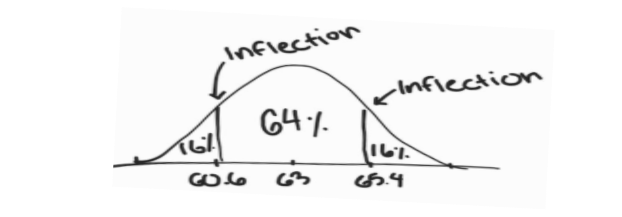
The average female height in the United States is 63 inches, having the standard deviation of 2.4.

Solution

We’ll represent this as

68% is within  μ ± σ: 63 ± 2.4= 60.6 to 65.4

32% is in the tails (below 60.5 and above 65.4)

16% is below 60.6 and 16% is above 65.4

Question

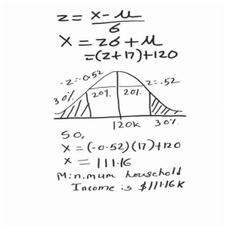
The average household income for people who can afford to buy a single family    home in California is $120k.The standard deviation is $17k. 30% of families weren’t able to afford a single family home. What is the minimum income required to buy a single family home in California?

Solution

Question

The goods carrier tuck travels an average speed of 50 miles/hr  and a standard deviation of 15 mile/hr. Truck company wants to know the probability of trucks that will have speed between  50 and 70 miles/hours.

Solution

Let x be the random variable that represents the speed. It has a mean of 50 miles/hr  and a standard deviation of 15 miles/hr. We have to find the probability that x is between 50 and 70 or P( 50< x < 70)

For x = 50 , z = (50 - 50) / 15 = 0

For x = 70 , z = (70 - 50) / 15 = 1.33 P( 50< x < 70) = P( 0< z < 1.33) = [area to the left of z = 1.33] - [area to the left of z = 0]=

0.9082 - 0.5 = 0.4082

The probability of a truck that has a speed between 50 and 70 miles/hours is equal to 0.4082.

Download FREE Math Resources

Take advantage of our free downloadable resources and study materials for at-home learning.

8 Math Hacks and Tricks to Turn Your ‘Okay’ Math Student Into a Math Champion!

One thing we teach our students at Thinkster is that there are multiple ways to solve a math problem. This helps our students learn to think flexibly and non-linearly.

Get PDF

How to Make Sure Your Child is Highly Successful and Becomes a Millionaire

As a parent, you hope your child is extremely successful and likely become the next Gates, Zuckerberg, or Meg Whitman. To set your child on the right path, there are many skills and traits that you can start building and nurturing now. Doing so plants the seeds for future success.

Get PDF

Practice Math Problems

1. The high school team had an average scrabble games score of 527 points and a standard deviation of 112. What is the probability of an individual scoring above 500 on the scrabble score?

2. The high school team had an average scrabble games score of 527 points and a standard deviation of 112.How high must an individual score on the scrabble game  in    order to  score in the highest 10 %

3. The average salary of a construction worker is  4,300 dollars per Month, with a standard deviation of 750 dollars. The distribution of salary is normal. What is the probability of income that between 2,500 and 4,200 dollars  will be in any given month

4. The average salary of a construction worker is  4,300 dollars per Month, with a standard deviation of 750 dollars. The distribution of salary is normal. What number corresponds to 45% of salary?

Related Topics

Your Child Can Improve Their Math Scores By 90% Within 3 months!

Our elite math tutors are ready to help make your child a math champion! Sign up for our zero $ free trial to get started today.

Try for Free