How can we use the concept:
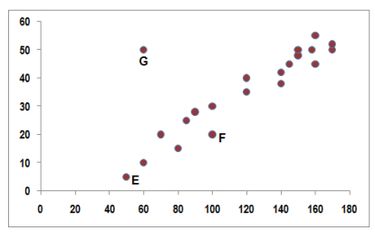
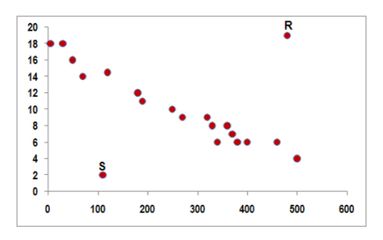
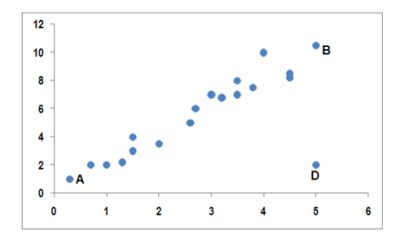
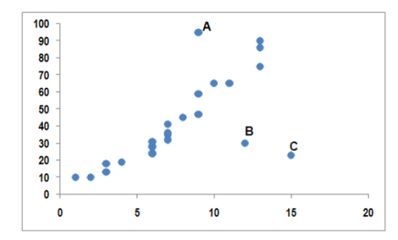
Outliers are identified by the fact that they don’t follow the general trend of the data.
On a scatter plot, the point would not match the general trend of the rest of the data. Data sets can have no outliers, one outlier or multiple outliers.
When looking at a set of data, the outlier is much higher or lower than the rest of the data set.