What is correlation?
Correlation is the measurement of any relationship between two variables. As one variable changes, so does the other variable.
What is Causation?
Causation is a correlation between two variable in which one variable causes a change in the other variable.
Correlation does not automatically mean causation. Some correlations can just be coincidence or could be occurring because a completely different factor is affecting both variables.
How can you see correlations and causation on a scatter plot?
Correlations show the relationships between two variables. There are three types of correlations. They are positive correlations, negative correlations, and no correlation.
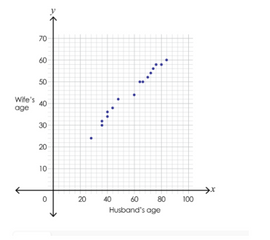
A positive correlation occurs when both variables increase.

The scatterplot above shows a positive correlation. As the age increases, so does the value. The x and y variables are both increasing. We cannot say this is causation, because there is no evidence that the increase in age is affecting the value. It could just be a coincidence.
In this next example, we see a negative correlation.

This is a negative correlation because as the age increases, the value decreases. Negative correlations occur when the x variable increases and the y variable decreases.
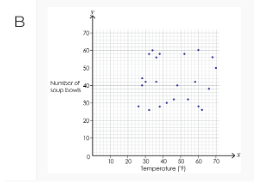
Lastly, a scatterplot may show no correlation. The example below shows no correlation because there is no pattern between the x and y variables.

In some cases the correlations between the two factors may be causation because the changes in one variable may be causing the changes in the other variable. In other scenarios, the changes may just be a coincidence or a third factor causing the change.
Sample Math Problems
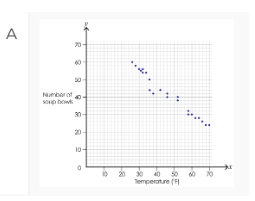
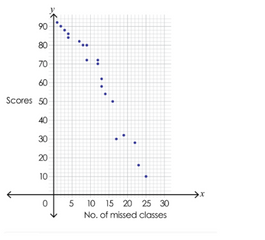
1) The scatter plot shows the scores high school students received in a chemistry class and the number of days of Chemistry class they missed. What type of correlation is shown?
Answer:
In this problem, the scatterplot shows a negative correlation. We know this is a negative correlation because as the x variable increases, the y variable decreases. As the number of missed classes increases, the test scores decrease.
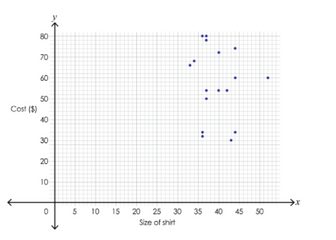
2.) Students were asked for their test scores on all the math and science tests they took during the school year. What does the data in the scatter plot show?
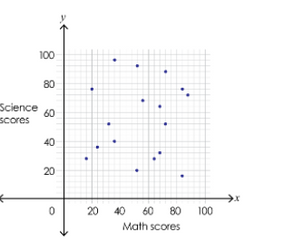
Answer:
In this problem, the scatter plot shows no correlation. There is no pattern shown between the x and y variables.
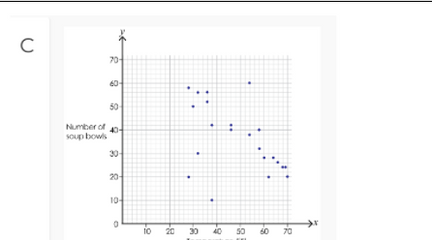
3.) Identify the scatter plot that shows no association between the sales of watermelons and potatoes.
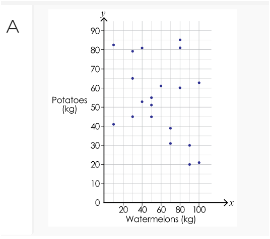
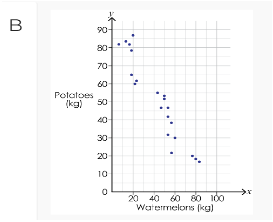
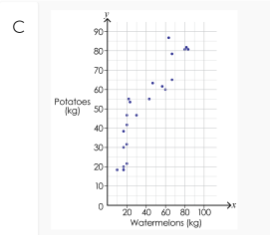
Answer:
The answer to this problem is A. A shows no association between the watermelons and the potatoes. B and C are not the correct answers because B shows a negative correlation and C shows a positive correlation.
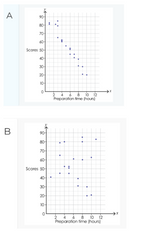
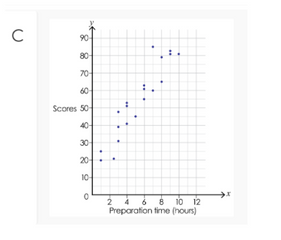
4.) Identify the scatter plot that shows a strong positive association between the number of hours worked by various employees in different professions and the amount earned.
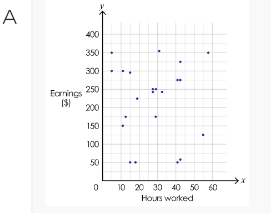
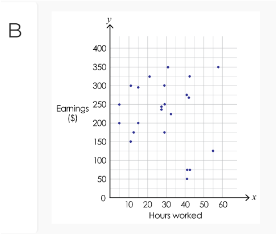
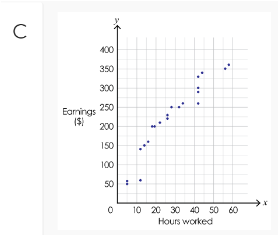
Answer:
The answer to this problem is C. A and B are incorrect because they both show no correlation between the hours worked and the money earned. C is correct because it shows a positive correlation. As the x variable increases, the y variable tends to increase.