How can we use positive correlation?
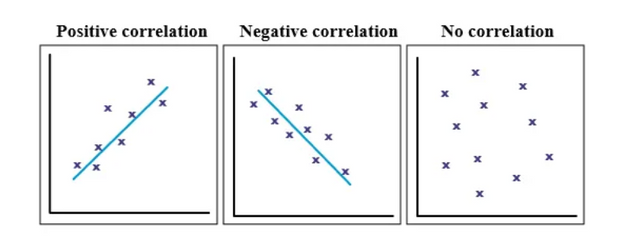
There are three different types of correlation you use when describing the relationship between two variables. We use scatterplots to show these relationships or associations between the two numerical variables that can be represented as a point. We can find the strength and direction of these points. Negative correlation implies that the variables are moving in different directions, positive correlation implies that the variables move in the same direction, and no correlation means that the variables are not related and the scatterplot cannot find any shape.
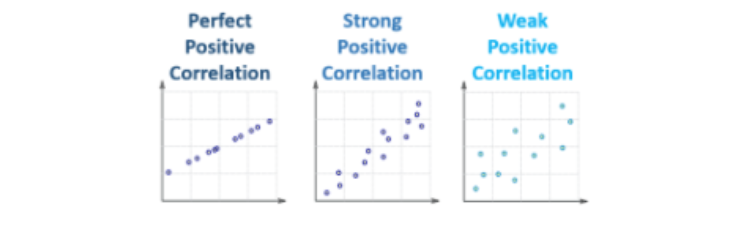
We can use correlation coefficients to also help describe the strength of a graph. We can categorize the strength into three options: strong, moderate, or weak. In general, we focus on strong versus weak when describing the scatterplots. The correlation coefficient, r, can also tell us how strong of a correlation the variables have. The values range from -1 to 1. A correlation of 1 means there is a perfect positive correlation and any numbers between 1 and 0 imply a positive correlation. The closer to 1, the stronger the correlation is. It is important for researchers to be able to easily see if there is a potential relationship between variables to draw conclusions about what they are studying. Keep in mind that correlation does not necessarily mean causation!